Hello Divi enthusiasts, Ken from Divi Supreme!
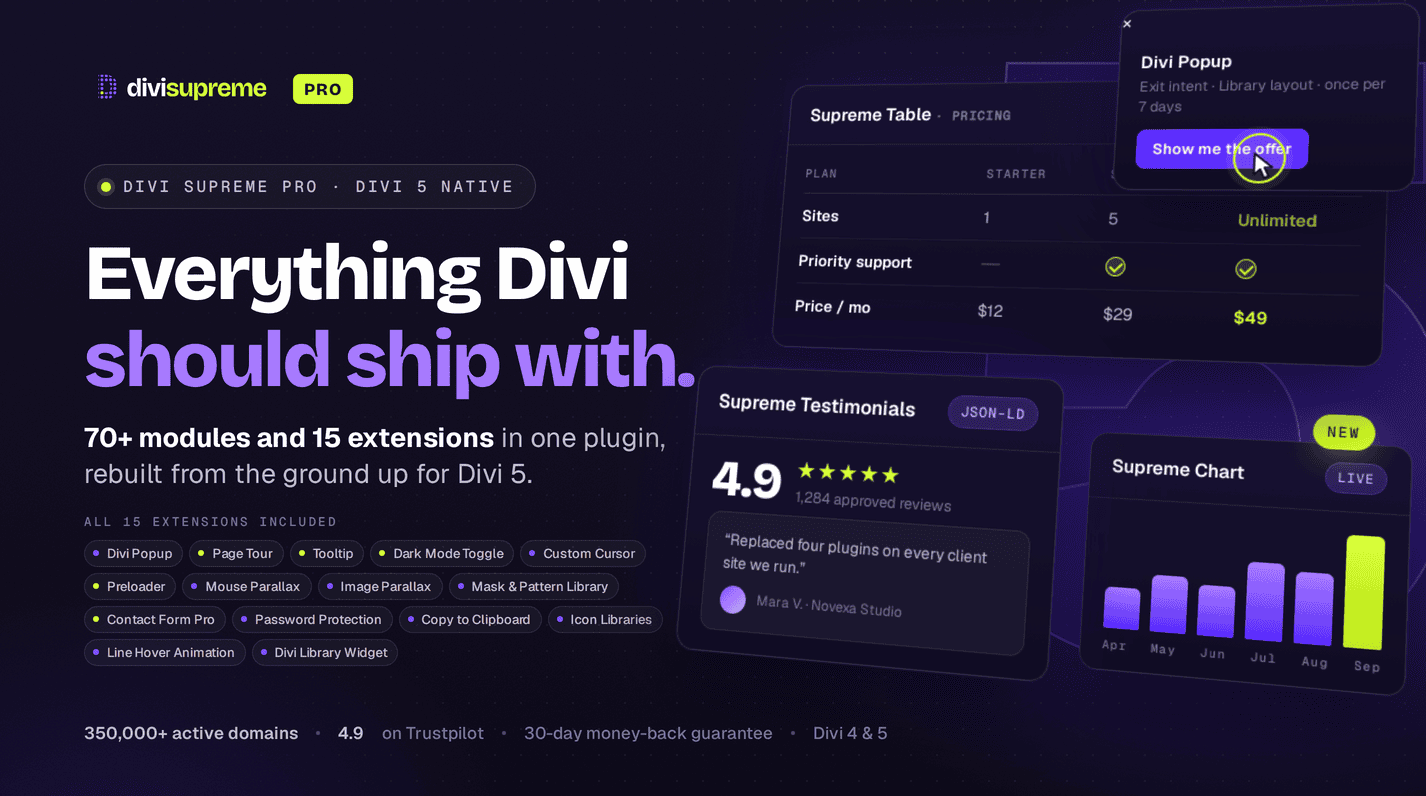
Numbers tell a story — but only if people can actually see it. A wall of figures gets skimmed and forgotten. A clean, colourful chart gets understood in a second and remembered long after. That's exactly what our brand new Supreme Chart Module brings to Divi.
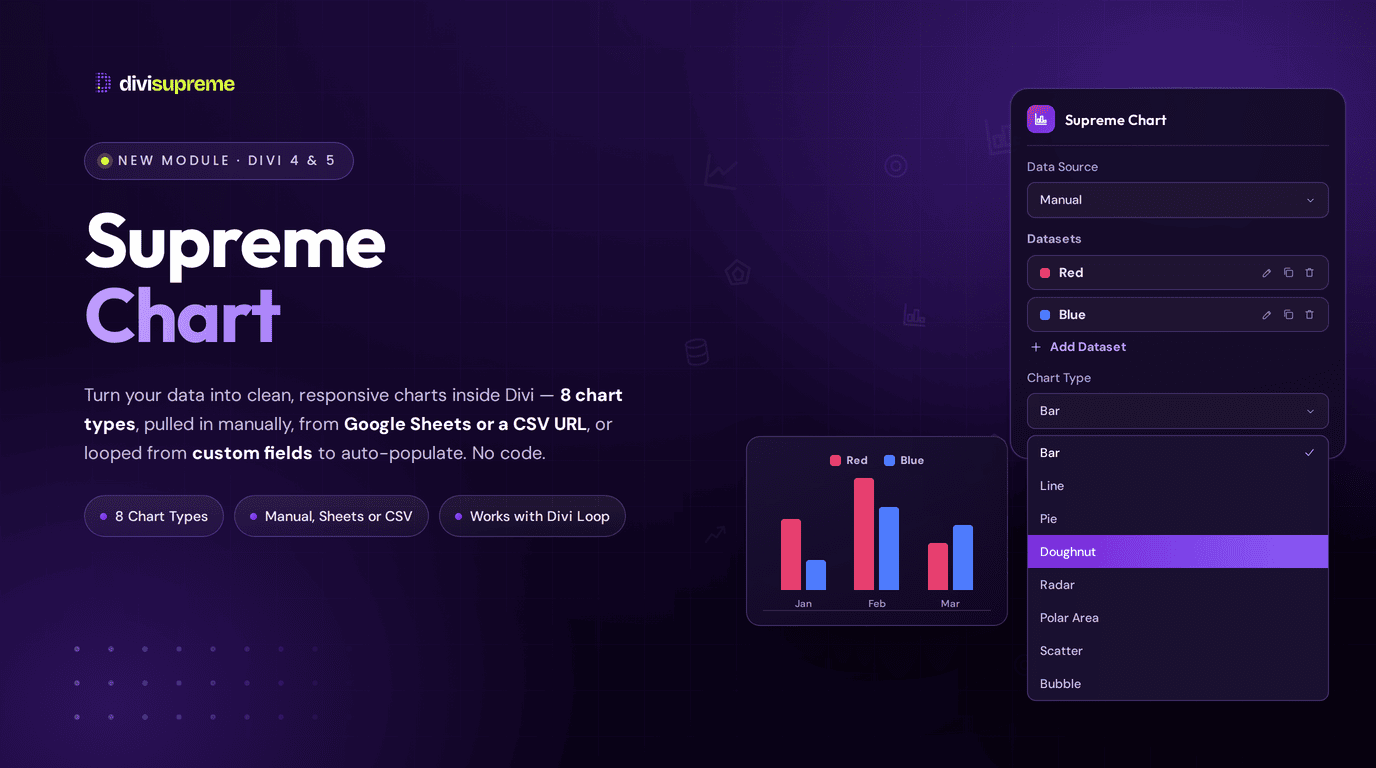
Now available in Divi Supreme Pro (latest version 5.0.47 — see note below), the Chart module lets you drop professional, responsive data visualisations straight into your layouts — with your choice of eight chart types, data pulled manually or live from Google Sheets and CSV, and full Dynamic Content support. No third-party chart service, no code.
What Is the Chart Module?
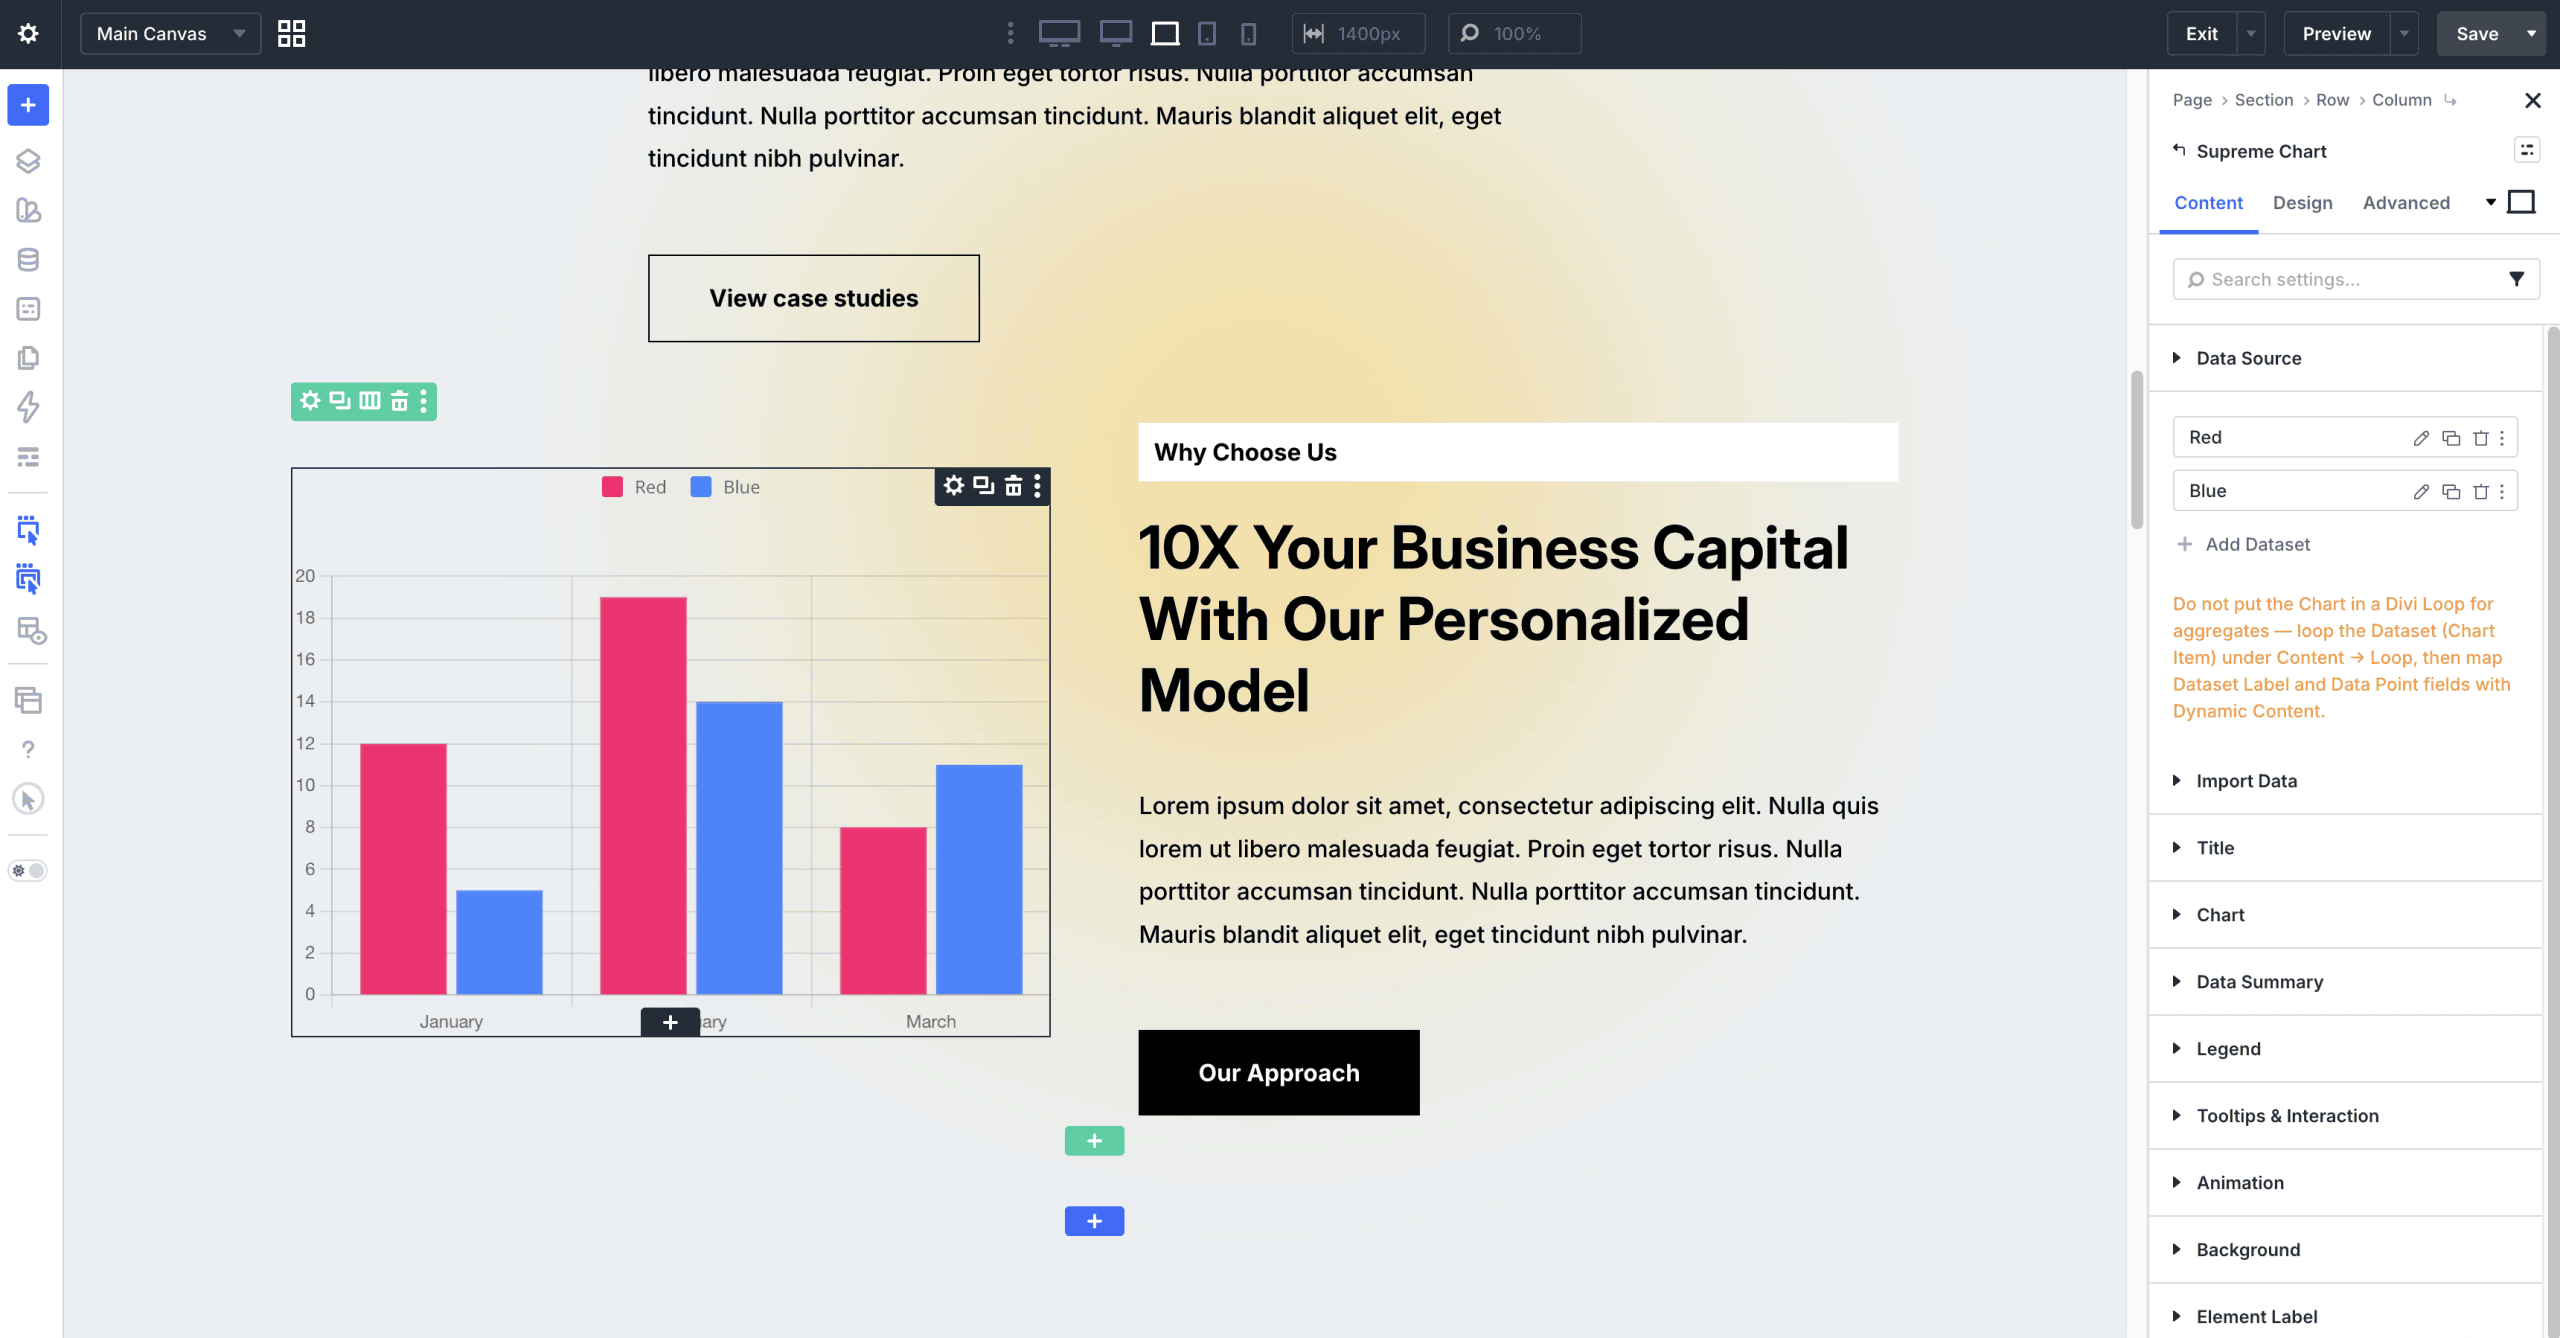
It's a native Divi module that renders your data as a crisp, responsive chart right on the page. You add one or more datasets, enter (or connect) your data, choose a chart type, and style it to match your brand. It behaves like any other Divi module, so it slots neatly into any section, row, or column.
Eight Chart Types for Every Kind of Story
Different data wants different visuals, so you get a proper range to choose from:
- Bar — the go-to for comparing values side by side.
- Line — perfect for trends and change over time.
- Pie and Doughnut — show proportions of a whole at a glance.
- Radar — great for comparing several qualities at once (think skills or ratings).
- Polar Area — a striking way to show relative sizes.
- Scatter and Bubble — ideal for relationships and correlations between values.
Switching type is a single dropdown, so you can try a few and keep whichever tells the story best.
Three Ways to Feed It Data (the standout)
This is what really sets the Chart module apart. Your Data Source can be:
- Manual — type your labels and values straight into the builder. Quick, simple, done.
- Google Sheets — connect a Google Sheet and your chart pulls from it. Update the sheet and your chart updates too — no need to touch the site. Perfect for stats a client or teammate can maintain themselves.
- CSV URL — point the chart at a CSV file and it reads the data from there, brilliant for reporting and exported data.
That means your charts don't have to be static. Hook one up to a sheet and you've effectively got live, self-updating visuals on your page.
Datasets and Data Points, Made Simple
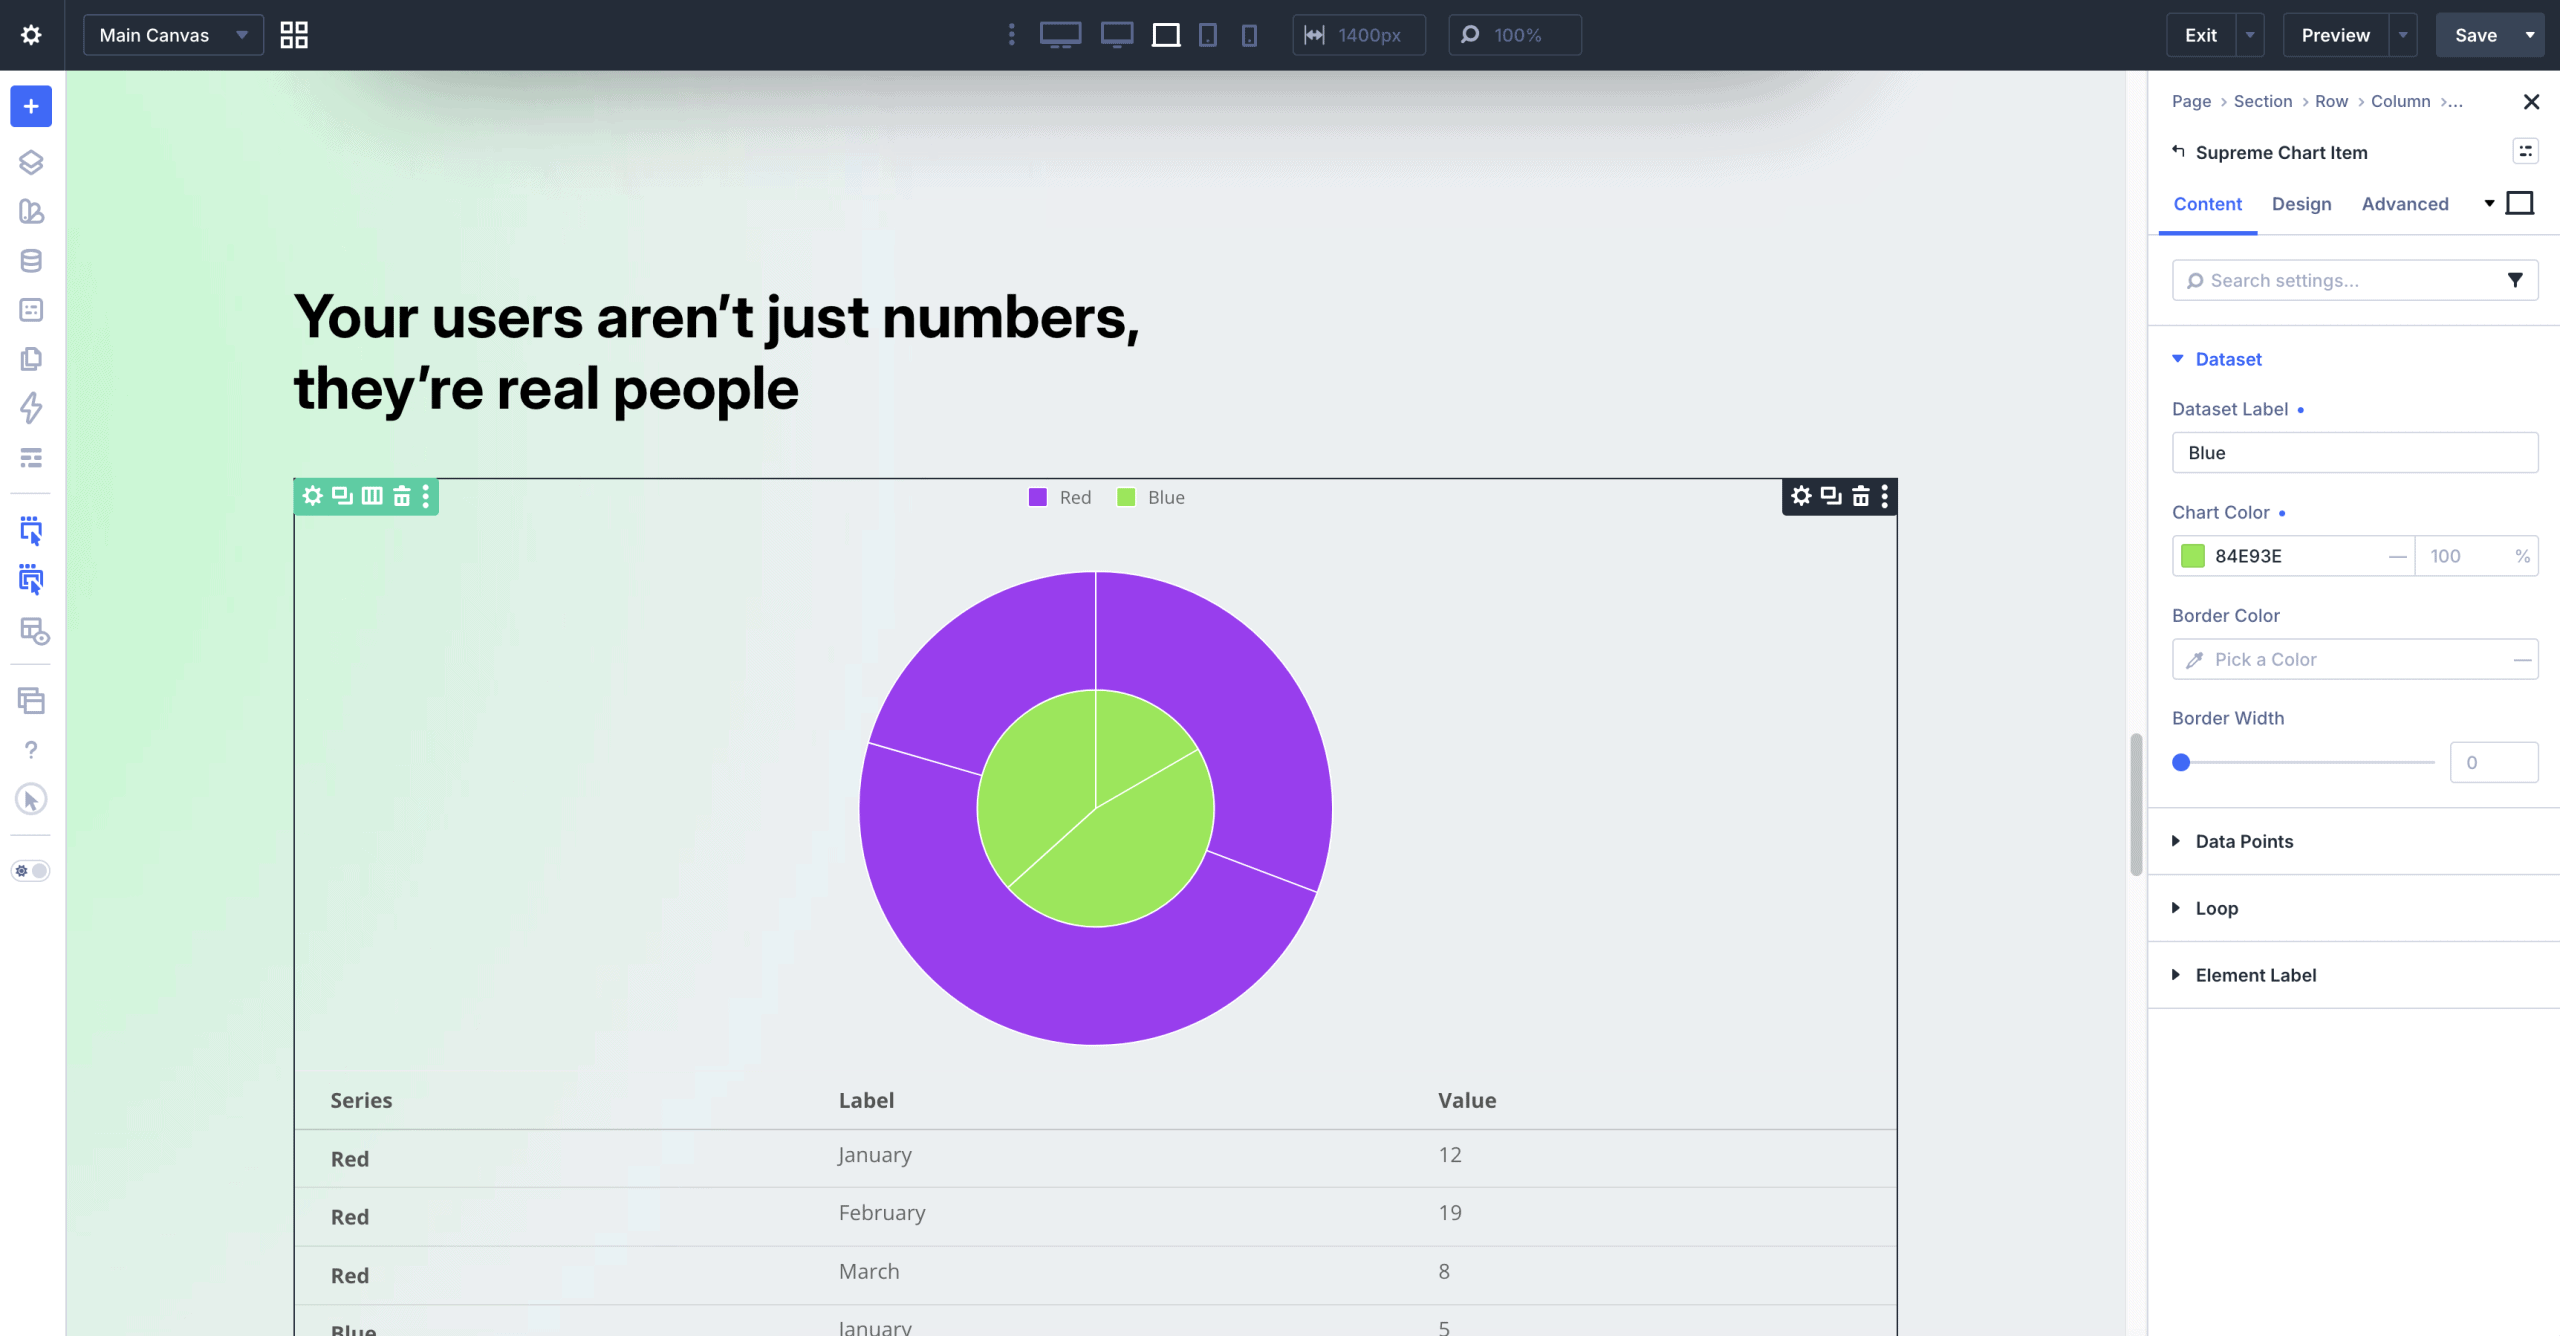
Structure-wise it's clean and flexible. Each dataset is a Supreme Chart Item — add as many as you need (say, one series for "Red" and one for "Blue") and they render together on the same chart. Inside each dataset, you add Data Points, and every point is just a Label and a Value (January = 12, February = 19, and so on). Add, duplicate, or remove points in a click.
Dynamic Content and Loops for Power Users
Here's where it gets clever. Both the Label and Value fields support Divi's Dynamic Content, so you can map them to custom fields, post meta, or other dynamic data instead of hard-coding them. Want a chart built from your custom post type or ACF fields? Loop the Dataset under Content → Loop and map the fields with Dynamic Content, and your chart builds itself from live site data. (Quick tip: loop the Dataset, not the Chart module itself, when you're aggregating.)
Responsive by Default
The module includes a Responsive toggle and a size control, so your charts look sharp and stay readable on every screen — no fiddling required.
Real Use Cases
- Company stats and KPIs. Show growth or results on your homepage — "revenue up 240%" hits far harder as a rising line than as text.
- Comparisons. Put your product or plan next to the alternatives with a clear bar chart, perfect for pricing pages.
- Live dashboards. Connect a Google Sheet so your numbers update automatically — ideal for clients who want to edit data without touching the site.
- Survey and poll results. Turn findings into a shareable pie or bar chart.
- Portfolios and resumes. Visualise skills or proficiency with a radar or bar chart.
- Reports and case studies. Back up your claims with visuals readers grasp instantly.
How to Add It
Because this is a module (not an extension), it's ready in the builder:
- Add a new module and search for the Supreme Chart module.
- Add one or more datasets with Supreme Chart Item, enter or connect your data, and give each dataset its data points.
- Pick your chart type and data source, and style it to taste.
If you don't see it, make sure the module is enabled under Divi Supreme → Modules.
Why It's Worth Using
Charts do something plain text can't: they make your data feel true and easy to trust. They break up long pages, hold attention, and communicate results at a glance — exactly what you want on sales pages, reports, and portfolios. And with manual, Google Sheets, and CSV data sources plus Dynamic Content, you're not limited to static numbers — you get clean, responsive, on-brand charts that can update themselves, built right into the builder you already use.
Ready to Visualise Your Data?
Update to the latest Divi Supreme Pro, drop in the Chart module, and turn those numbers into something people actually notice. Your data deserves better than a bullet list.
These are just a few of the many improvements — your feedback is making Divi Supreme Pro for Divi 5 stronger every day. If you spot something, report it here!
Stay tuned for more updates, and please don't hesitate to reach out if you have any questions or need assistance with anything related to Divi Supreme or Divi 5.
Best Regards,
Ken and the Divi Supreme Team
How to access all Divi Supreme Modules
To access Divi Supreme Modules, you need to purchase the Pro version of our plugin. The Professional plan come with a 30% discount on renewals while we also offer you premium support and free updates during the licensing period.
Our goal is to assist you to create beautiful and effective business websites without impacting negatively on user experience.
So, give Divi Supreme Pro a try today, and don’t forget to share your experience with the Divi Supreme Plugins in the comments section below.
Or try out the Divi Supreme Lite
Divi Supreme Lite Offers 20+ Modules and 3 Beautiful Extensions and using them you can easily extend your site’s functionality.